Generative Art using Python and AxiDraw Pen Plotter
This tutorial shows how to make generative art using Python and AxiDraw pen plotter. I also published this tutorial on mirror.xyz for testing out web3 publishing experience.
The code can be accessed at Github Repo.
You should start with axidraw-basics.ipynb notebook, which shows how to setup AxiDraw V3 and use Python to control it to plot a simple SVG.
After that, you can look at voronoi-art.ipynb notebook for a more complicated tutorial on generating art based on Voronoi diagram like:

It’s fun to watch the plotting process. I named my AxiDraw pen plotter “Bohu” after Bohu Tang (1470-1524) - a Chinese painter, calligrapher, and poet of the Ming dynasty period, who is 18 years younger than Leonardo da Vinci (1452-1519).

It looks awesome after framed:

Setup Inkscape and Axidraw Driver
Please follow the instructions and do the followings:
- Download and install the latest version of Inkscape for Mac (1.1 tested)
- Download and run the latest AxiDraw installer (AxiDraw_Install_Mac_274r1 tested)
Axidraw via Python
You can setup the environment as follows (tested with Python 3.8+)
$ python3 -m venv venv
$ source venv/bin/activate
$ pip install -r requirements.txt
then, jupyter lab to run the notebook axidraw-basics.ipynb to learn how to setup Axidraw and plot a simple SVG image.
Plotting via Inkscape
Once you have the SVG ready, you can follow the steps below to plot it via AxiDraw using Inkscape:
Open Inkscape and choose the paper size - here I choose Letter in landscape (this is related to how to position the paper under AxiDraw):

Open the SVG:

Choose AxiDraw Control:

Setup AxiDraw using “Raise pen, turn off motors” and move the plotting head to the Home position (see your AxiDraw machine - there is a Home):

Setup the pen using “Pen up” and adjust the pen tip 3mm-6mm above the paper.
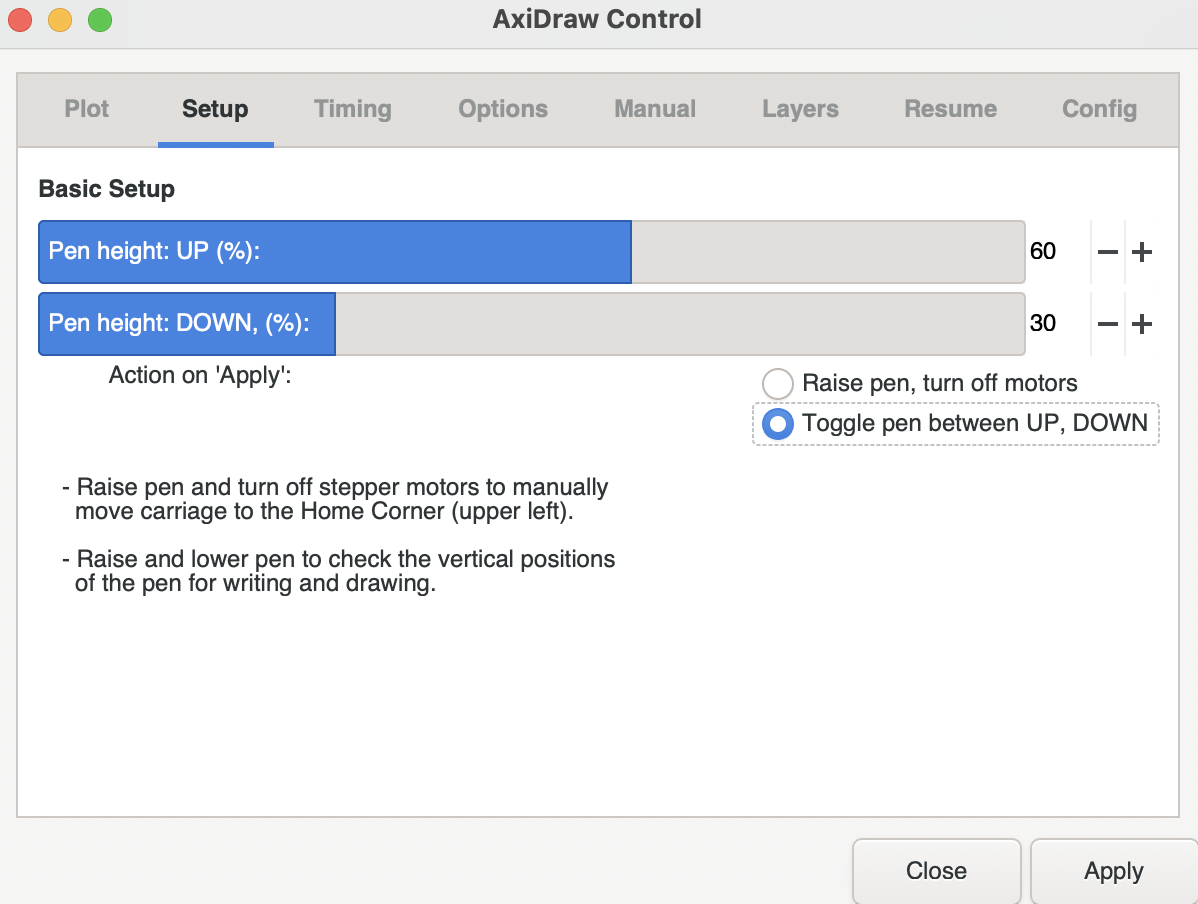
Position the left upper corner of the paper directly underneath the pen tip and start plotting using the Apply button shown below. Note that the plotting will pause if the computer goes to sleep.

References
This tutorial is based on the following tutorials: